How to Start Profiling a Golang Application
Crash course in how to get to know your app better
What is an app profiling?
In general, the application profiling is the process of analyzing the behavior and performance of an app to identify its bottlenecks, inefficiencies, and areas for optimization. This usually involves collecting detailed information about various aspects of the application, such as:
CPU and memory usage
Execution time
I/O operations
Threading and concurrency
Resource utilization
Types of collected data might differ between profilers and programming languages.
How to profile your app?
Step 1: Blank import the pprof package for the side effects - it will start collecting the profiling data
import (
    _ "net/http/pprof"
)
Step 2: Expose the pprof debug HTTP endpoint:
go func() {
    log.Println(http.ListenAndServe("localhost:6060", nil))
}()
And that’s it! You’re good to good! You can access now your profiler at the http://localhost:6060/debug/pprof/
Note: Please remember, that your program needs to be running in order to access the profiler at the mentioned link. If it’s terminating after you run it - it doesn’t have a worker nature, that is constantly running until you kill it, just add the following snippet at the end of your main function:
<-make(chan any)

// The same as:
// ch :=  make(chan any)
// <-ch
This will keep your program running. It creates an empty channel of any type and waits for a data to pull it from. Since no one is sending there anything, the program will keep waiting and running.
Your program already exposes an HTTP server? That’s not a problem! All you need to do is just blank import the pprof package. The pprof handlers will be automatically registered under the /debug/pprof/. Let’s say you have exposed an HTTP server at the port 8080, then your pprof debug session will be available at the http://localhost:8080/debug/pprof/.
You don’t have to also block the program termination in such case, because the HTTP server blocks the main goroutine, preventing the program from exiting.
To recap, the whole code looks like this:
package main

import (
    "log"
    "net/http"
    _ "net/http/pprof"
)

func main() {
    go func() {
        log.Println(http.ListenAndServe("localhost:6060", nil))
    }()

    // Your code goes here

    <-make(chan any)
}
What does the profiler says?
My profiler is exposed at the 6060 port, so visiting the URL http://localhost:6060/debug/pprof/ I see:

The profiler data are split into the following sections:
allocs: A sampling of all past memory allocationsblock: Stack traces that led to blocking on synchronization primitivescmdline: The command line invocation of the current programgoroutine: Stack traces of all current goroutines. Use debug=2 as a query parameter to export in the same format as an unrecovered panic.heap: A sampling of memory allocations of live objects. You can specify the gc GET parameter to run GC before taking the heap sample.mutex: Stack traces of holders of contended mutexesprofile: CPU profile. You can specify the duration in the seconds GET parameter. After you get the profile file, use the go tool pprof command to investigate the profile.threadcreate: Stack traces that led to the creation of new OS threadstrace: A trace of execution of the current program. You can specify the duration in the seconds GET parameter. After you get the trace file, use the go tool trace command to investigate the trace.
Feel free to explore the available sections to get to know your app better.
Visualizing profiler data
If you prefer the visual way of analyzing the data, the pprof tool comes for the rescue.
Step 1: Install the pprof tool:
go install github.com/google/pprof@latest
Step 2: Install the Graphviz to generate the graphic visualizations of profiles:
brew install graphviz
Make sure that the graphviz/bin directory is in your $PATH, otherwise the pprof won’t be able to generate visualizations.
Now, the full example on how to visualize the profile data with the pprof and the graphviz.
I have the following code in the worker package (directory):
package worker

import (
    "context"
    "log"
    "time"
)

const (
    interval = time.Second * 3
)

type worker struct {
}

func (w worker) run(ctx context.Context) {
    t := time.NewTicker(interval)
    defer t.Stop()

    for {
        select {
        case <-ctx.Done():
        // cleanup
        case <-t.C:
            log.Println("Worker cycle")
        }
    }
}

func Start(ctx context.Context) {
    log.Println("Starting worker")

    w := worker{}
    w.run(ctx)
}
And that’s how my main program looks like now:
package main

import (
    "context"
    "log"
    "net/http"
    _ "net/http/pprof"

    "github.com/flashlabs/tools/worker"
)

func main() {
    go func() {
        log.Println(http.ListenAndServe("localhost:6060", nil))
    }()

    ctx := context.Background()
    worker.Start(ctx)
}
Now I just start my program:
go run main.go
2024/09/22 13:29:06 Starting worker
2024/09/22 13:29:09 Worker cycle
2024/09/22 13:29:12 Worker cycle
2024/09/22 13:29:15 Worker cycle
...
And to visualize the goroutines:
Step 1: Download the goroutine profile and save it in the goroutine_profile.prof file
curl http://localhost:6060/debug/pprof/goroutine -o goroutine_profile.prof
Step 2: Run the pprof to analyze and visualize the data in saved file:
go tool pprof goroutine_profile.prof
Now you are in the the pprof interactive mode, you can f.e. display the functions and how many goroutines are in each state with the top command:
go tool pprof goroutine_profile.prof
File: main
Type: goroutine
Time: Sep 22, 2024 at 1:09pm (CEST)
Entering interactive mode (type "help" for commands, "o" for options)
(pprof) top
Showing nodes accounting for 5, 100% of 5 total
Showing top 10 nodes out of 36
      flat  flat%   sum%        cum   cum%
         4 80.00% 80.00%          4 80.00%  runtime.gopark
         1 20.00%   100%          1 20.00%  runtime.goroutineProfileWithLabels
         0     0%   100%          1 20.00%  bufio.(*Reader).Peek
         0     0%   100%          1 20.00%  bufio.(*Reader).fill
         0     0%   100%          1 20.00%  github.com/flashlabs/tools/worker.Start
         0     0%   100%          1 20.00%  github.com/flashlabs/tools/worker.worker.run
         0     0%   100%          1 20.00%  internal/poll.(*FD).Accept
         0     0%   100%          2 40.00%  internal/poll.(*FD).Read
         0     0%   100%          3 60.00%  internal/poll.(*pollDesc).wait
         0     0%   100%          3 60.00%  internal/poll.(*pollDesc).waitRead (inline)
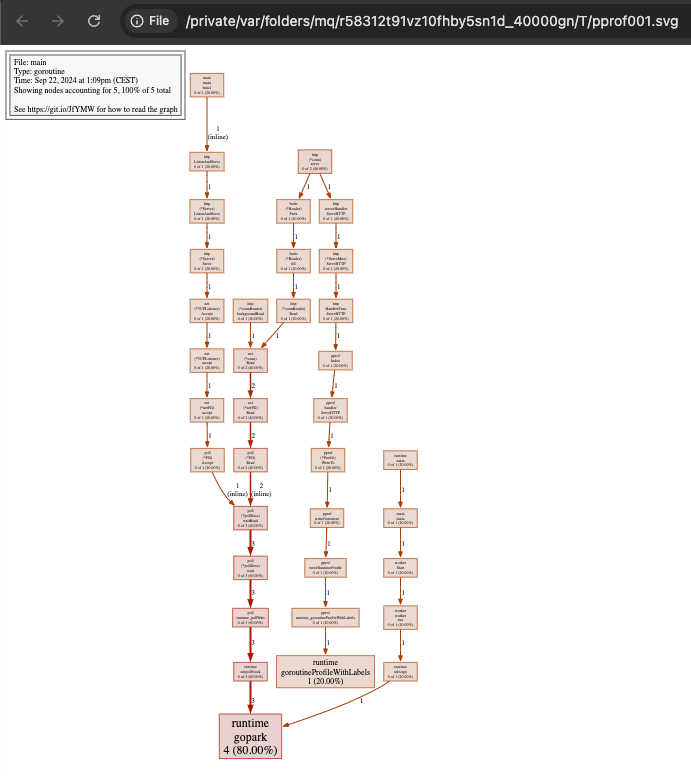
To visualize the same data, just type the web in the pprof interactive mode:
(pprof) web
This will generate the visualized call graph of the goroutines and opens it in your browser immediately. The graph will looks like this:
For more information on how to read the visualization graphs and how to work with the pprof I strongly recommend to visit the pprof documentation page.
Sources
Pprof official page - https://github.com/google/pprof
Profiling Go Programs - https://go.dev/blog/pprof
Graphviz home page - https://www.graphviz.org/
About the author
Software Engineer x Data Engineer - I make the world a better place to live with software that enables data-driven decision-making
Comments
Join the discussionNo comments yet. Be the first to comment.